
An interface counter is a cumulative total. A utilization alert is a calculation made from two or more samples. A reset, row identity change, wrong interval or unsuitable counter width can produce a dramatic graph without demonstrating real congestion. Validate the interval before tuning the alert threshold.
Scope and evidence: Proposed SNMPv3 monitoring of a full-duplex 1 Gbit/s Ethernet interface using IF-MIB high-capacity counters. Agent 192.0.2.50, illustrative ifIndex 7 and a 60-second manager interval are documentation examples. All numbers below are synthetic arithmetic, not captured utilization. This is a single interface, not an assumed port-channel capacity model. No real incident, live polling or measured performance is claimed.
Collect SNMP Counter, Interface Identity and Speed Evidence
Store device identity, ifName/ifIndex mapping, inbound/outbound Counter64 values, manager elapsed time, sysUpTime, ifCounterDiscontinuityTime, interface state and current speed with each sample. Map index to identity after rediscovery; a reused row can look like the same port while representing a different object.
On the Net-SNMP manager, with v3 algorithms/secrets already stored in a protected configuration profile, use this bounded read-only request:
snmpget -v3 -l authPriv -u labPoller -On 192.0.2.50 .1.3.6.1.2.1.1.3.0 .1.3.6.1.2.1.31.1.1.1.1.7 .1.3.6.1.2.1.31.1.1.1.6.7 .1.3.6.1.2.1.31.1.1.1.10.7 .1.3.6.1.2.1.31.1.1.1.15.7 .1.3.6.1.2.1.31.1.1.1.19.7
In order, these request sysUpTime, ifName, ifHCInOctets, ifHCOutOctets, ifHighSpeed and ifCounterDiscontinuityTime. Replace 7 using actual discovery. A single response groups the observations, but does not guarantee that every object was sampled at the identical hardware instant. The expected types are timeticks, name, two Counter64 values, speed in millions of bits per second and a discontinuity timeticks marker. Missing objects need the OID/view guide; a timeout needs the polling guide.
The object definitions and counter continuity contract are in IF-MIB, RFC 2863. A device restart is not the only possible discontinuity: interface counter state may reset without the entire system restarting. Conversely, sysUpTime can wrap after roughly 497 days; a decrease is a reason to rebaseline conservatively rather than proof of a reboot.
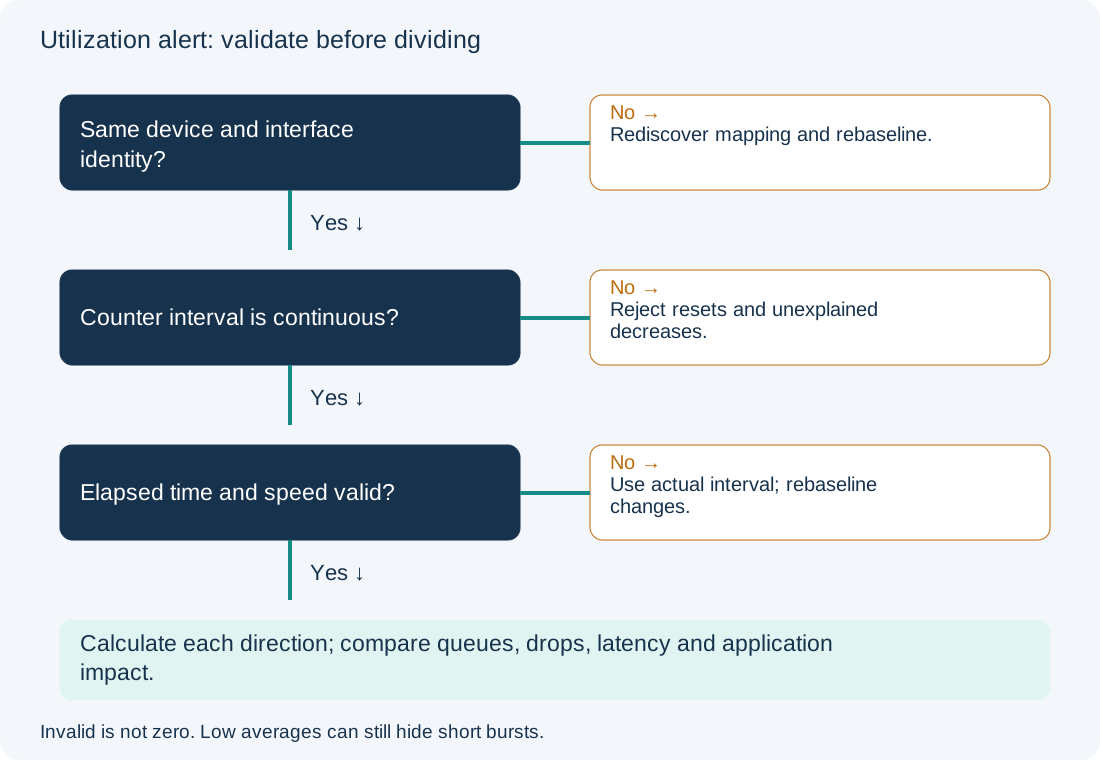
Reject SNMP Rate Intervals After Resets or Identity Changes
| Validation | Why it matters | Treatment |
|---|---|---|
| Same device and interface identity | Rediscovery/reuse can change the row | Rebaseline when identity changes |
| No uptime/discontinuity change indicating reset | Arithmetic across a reset is meaningless | Mark interval invalid and retain new baseline |
| Positive actual elapsed interval | Poll scheduler delay changes the divisor | Use recorded elapsed time, not nominal 60 seconds |
| Same known speed and interface state | Speed or state transitions change interpretation | Rebaseline transitions and inspect evidence |
| Suitable counter width | Counter32 can wrap multiple times between polls | Prefer supported high-capacity counters |
At 1 Gbit/s, a 32-bit octet counter can wrap in about 34.36 seconds at sustained line rate. A 60-second pair can therefore be ambiguous; adding 2**32 once after a negative delta does not recover multiple wraps. A reset can also look like a wrap. Do not apply modulo arithmetic blindly. This guide deliberately uses Counter64 and discards decreases; it does not attempt to reconstruct wrapped or reset intervals.
Calculate Directional Interface Utilization from Octet Deltas
For a valid interval: bits per second = 8 × delta_octets / elapsed_seconds. Directional utilization percentage = 100 × bits_per_second / speed_bps. If ifHighSpeed reports 1000, the denominator is 1000 × 1,000,000 bits/s, not 1000 bits/s.
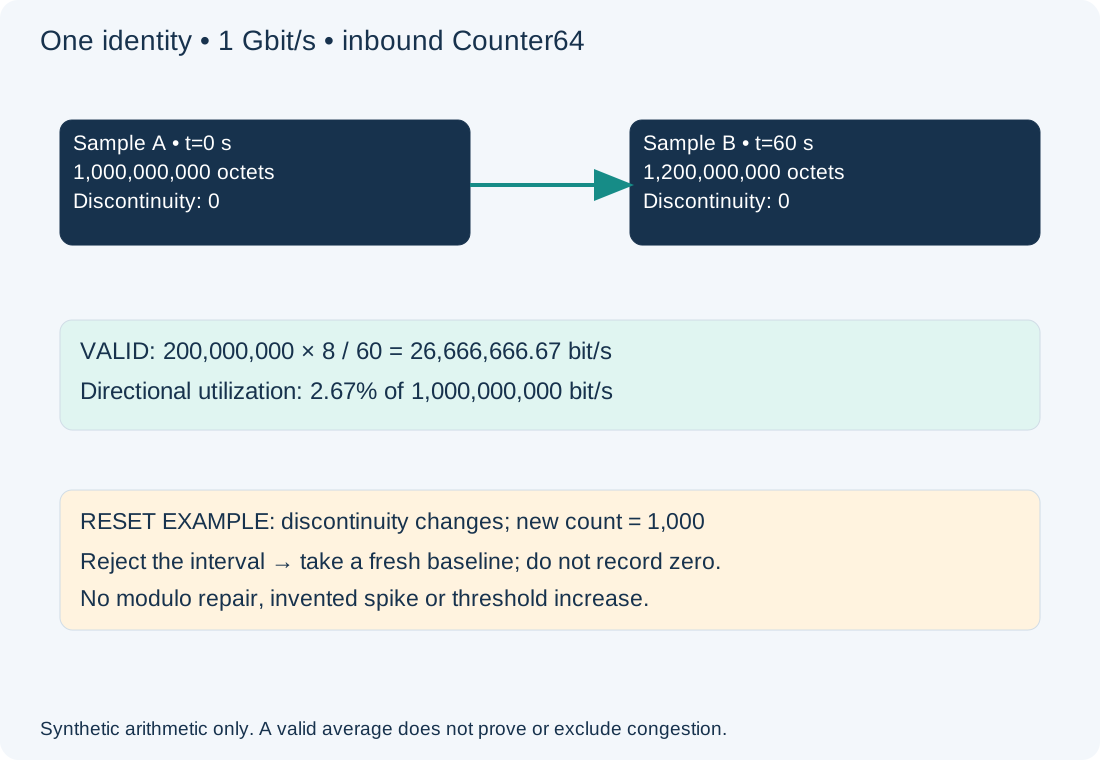
Synthetic example: inbound counter grows from 1,000,000,000 to 1,200,000,000 octets over 60 seconds. That is 26,666,666.67 bit/s, or about 2.67% inbound at 1 Gbit/s. Outbound needs its own delta. Summing inbound and outbound and dividing by one direction’s line rate is not the usual full-duplex directional utilization and can exceed 100% without proving overload. A port-channel denominator needs actual active membership and traffic distribution, not a fixed member count.
This pure Python 3 example performs no polling or configuration changes. It accepts only same-identity, stable-speed Counter64 pairs; it intentionally returns None for an invalid interval:
def utilization(previous, current):
    if current["identity"] != previous["identity"]:
        return None
    if current["uptime"] <= previous["uptime"]:
        return None
    if current["discontinuity"] != previous["discontinuity"]:
        return None
    elapsed = current["time"] - previous["time"]
    speed = current["speed_bps"]
    if elapsed <= 0 or speed <= 0 or speed != previous["speed_bps"]:
        return None
    delta = current["octets"] - previous["octets"]
    if delta < 0:
        return None
    return 100 * 8 * delta / elapsed / speed

before = dict(identity="lab-switch/Gi1/0/7", uptime=10000,
              discontinuity=0, time=0.0, speed_bps=1_000_000_000,
              octets=1_000_000_000)
after = dict(before, uptime=16000, time=60.0, octets=1_200_000_000)
reset = dict(after, discontinuity=15000, octets=1000)
print(round(utilization(before, after), 2))  # Synthetic: 2.67
print(utilization(before, reset))           # Synthetic: None
Uptime/discontinuity fields are timeticks; time uses manager elapsed seconds. Use a monotonic manager clock for production interval measurement and rebaseline after collector restart. The function assumes validated numeric Counter64 input, stable operational state and a trustworthy speed; it is an educational core, not a complete NMS integration. It does not clamp suspicious values to 100%, which would conceal data-quality errors.
Distinguish High Utilization from Queue Congestion and Bursts
A valid high average is a capacity signal; congestion requires more context. Compare queue drops, discards, errors, latency and application impact over matching intervals. A low 60-second average can hide microbursts; a graph spike can reflect a bad denominator. On IOS XE, read-only interface inspection:
show interfaces Gi1/0/7
show interfaces counters errors
Compare identity, negotiated speed, current state and relevant counters. The CLI’s smoothed rates can use a different averaging window from the NMS, so exact agreement is not guaranteed. Do not clear counters to make the alert disappear. If this is a bundle, the LACP guide helps establish actual selected members before interpreting capacity.
Pilot a Discontinuity-Aware Monitoring Rule and Rollback
Monitoring configuration change: Save the existing poll template, counter type, identity mapping, interval and alert expression. Pilot Counter64 selection and discontinuity-aware rebaselining on one approved interface. Represent rejected samples as unknown/invalid; do not record them as zero or silently carry forward a normal value. Decide explicitly how the alert engine handles missing data and whether a separate polling/data-quality alert is required.
Replay synthetic normal, reset, counter-decrease, delayed-poll and speed-change cases before broad rollout. Expected behavior is a valid rate only for coherent pairs and no traffic-spike alert generated from reset arithmetic. Confirm real sustained-load detection remains effective using existing approved evidence or a separately authorized test; do not inject production traffic just to validate the template.
Rollback restores the saved template on the pilot and takes a fresh baseline. Rates computed under different counter types or speed assumptions should not be spliced into one interval. Keep raw samples so an alert can be audited later. No device counter reset or threshold increase is necessary to correct the demonstrated calculation fault.