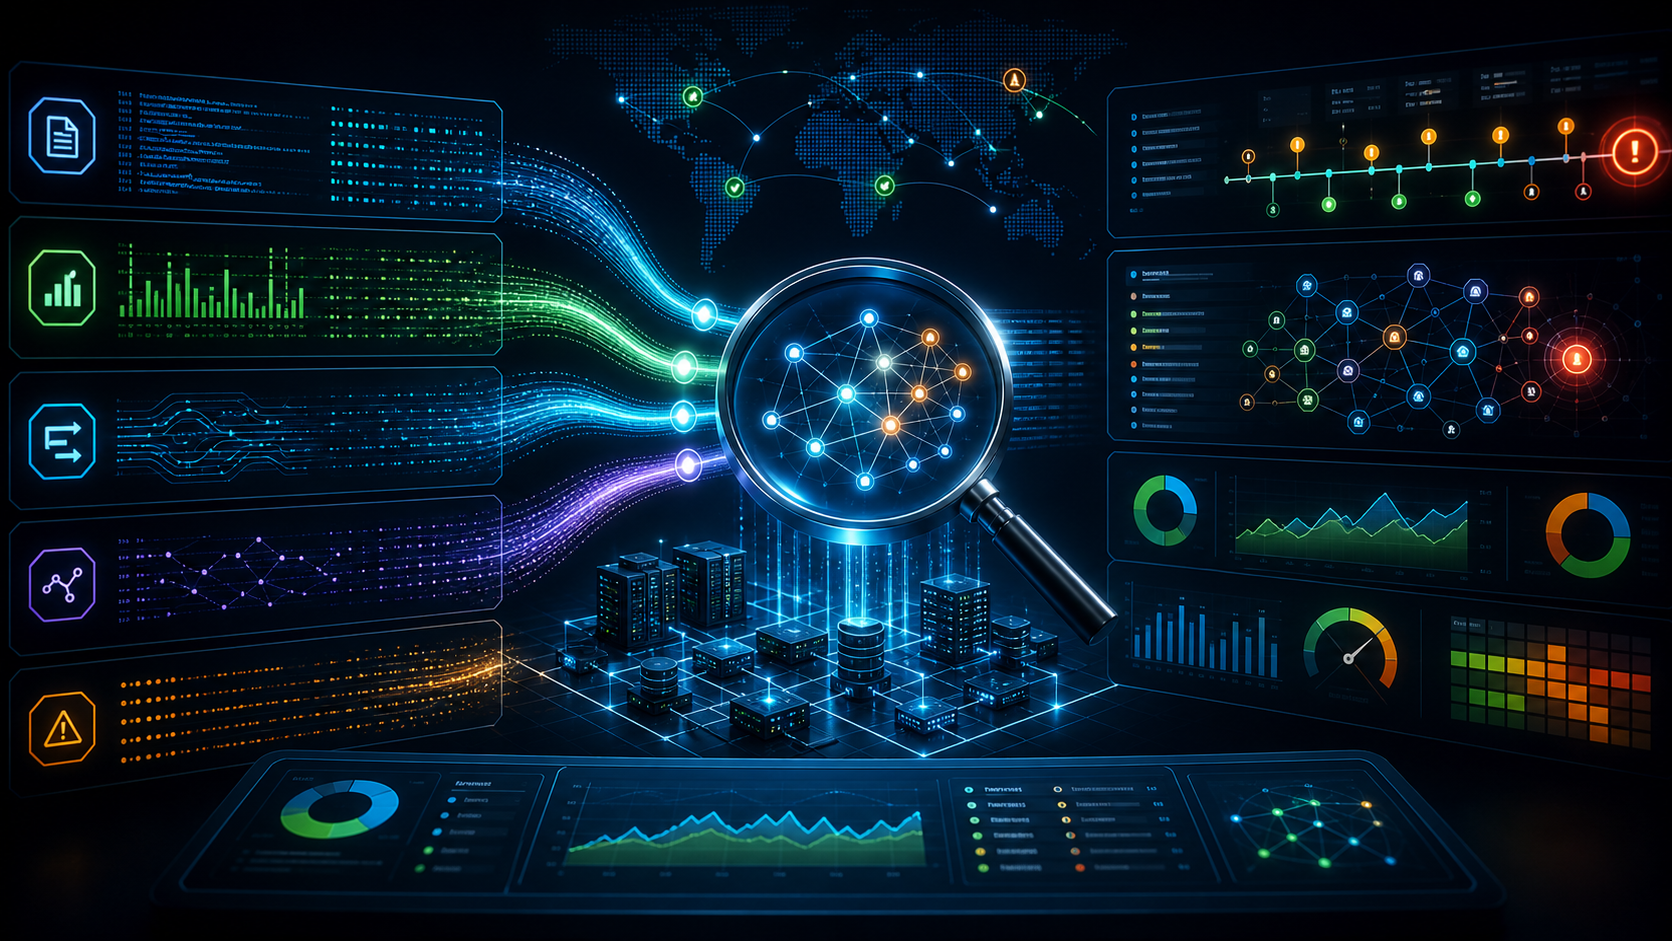
Network visibility gives an operator access to relevant observations. Observability is the ability to investigate system behavior from the signals available, including conditions that were not anticipated by a particular alert.
In NOC work, an unreachable-device alert starts an investigation. It does not by itself explain whether the cause is a link, power, management access, monitoring path or the device. This guide focuses on organizing evidence so a team can choose its next check.
Distinguish monitoring, visibility and investigation
Monitoring tracks selected conditions, such as interface state or a threshold. Visibility describes the available view of traffic and system events. Observability depends on whether those signals, with context, can answer useful questions about behavior.
The labels vary between products. Judge a system by the questions it supports rather than assuming that a dashboard named observability automatically identifies root cause.
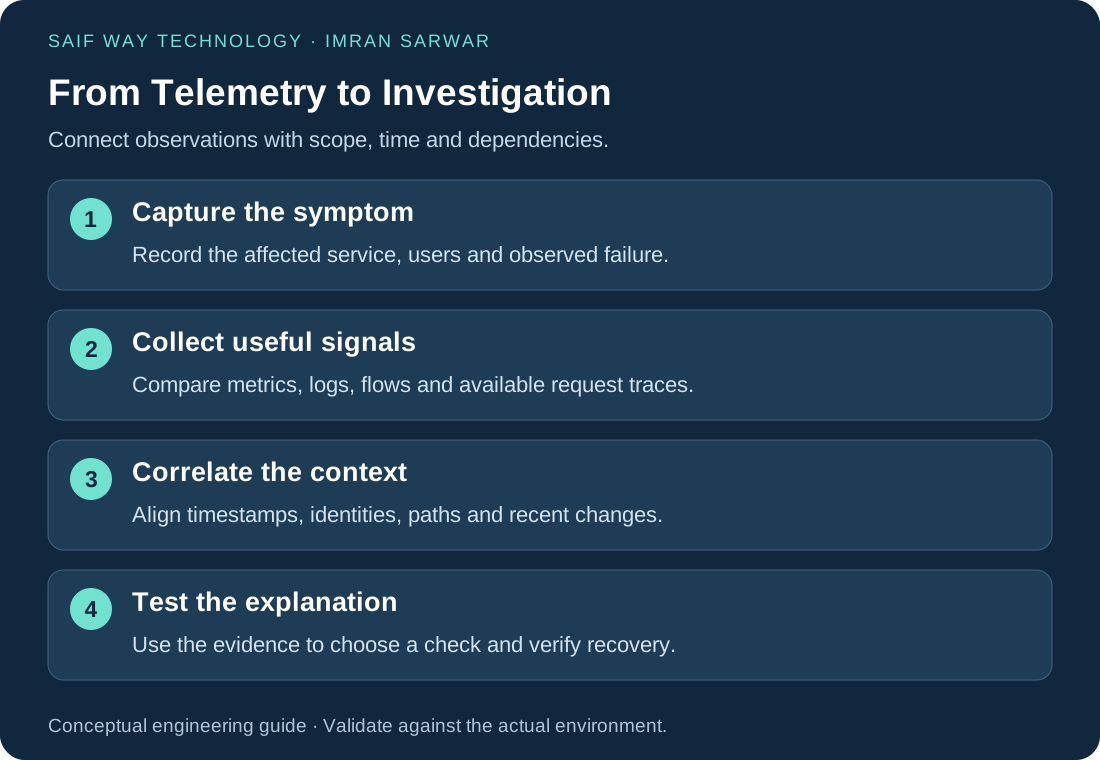
Choose telemetry signals for the affected service
For an application failure, consider the client experience, DNS result, connection path, authentication and application response. Network metrics, flow records and device logs provide different views. Application traces can add request-level context when instrumentation is present.
The OpenTelemetry observability primer explains the role of telemetry signals. A network device does not automatically emit application traces; plan collection around the systems and questions actually involved.
Align network, identity and application event timestamps
Record when the symptom was first observed, the time zone, affected endpoints and recent changes. Check that timestamps can be compared before linking events from different systems. A clock difference can create a misleading sequence.
A useful incident record identifies the observation, source, timestamp, scope and uncertainty. Include healthy comparison cases and missing evidence. For example, successful access from another client is useful only when the tested service, identity and path are understood.
Use correlation to choose the next test
Suppose an application error and an authentication event occur near an interface alarm. They may be related, but timing alone does not prove causation. Compare the affected users and dependencies and test which explanation matches the failure.
The NOC troubleshooting example shows why a network symptom can lead toward endpoint investigation. My ML detection lab illustrates an additional source of signals; a prediction still requires context and review.
Make telemetry usable and maintainable
Keep collection purposeful. Decide who can view the data, what sensitive information should be excluded and what retention supports the use case. Unbounded logging without ownership can make investigations harder and expose unnecessary data.
When asking for remote infrastructure support, share the symptom, time window, affected systems and sanitized evidence rather than a screenshot of one alarm alone. For a Flask reporting workflow, describe the data sources and operational question in the engineering inquiry form.